Order flow is the record of who traded, how much, and on which side, at every price, while a candle was forming. On futures you read it with four tools: the DOM (resting orders), the tape (executed trades), the footprint (bid and ask volume per price) and delta (the net of aggressive buying and selling). This guide gives you the working numbers we measured on our own MNQ, NQ and ES recordings: the first hour carries 34% of the day’s volume on MNQ and covers 75% of the session’s range, trades of 20 or more contracts carry 53% of MNQ volume, and buyers were the aggressor on 50.8% of volume in our recorded sample, which is why delta divergence matters more than the delta number.
What is order flow, in one minute?
Order flow is every executed trade with its size and the side that crossed the spread, plus the limit orders resting in the book around price. A candle tells you where price ended; order flow tells you what it took to get there. The aggressor is the side that paid the spread: a buyer lifting the offer or a seller hitting the bid. On the CME feed the exchange reports that side for each trade; in our MNQ recording of October 14–15, 2026, 100% of 8,526 trades carried an exchange-reported side, so nothing had to be guessed.
Two kinds of orders make the whole picture:
- Limit orders rest in the book and wait. They are the liquidity you see in the DOM. They can be pulled a millisecond before price arrives.
- Market orders consume resting liquidity now. They are the aggression you see on the tape and in the footprint. They cannot be faked after the fact.
What one session of order flow contains, from our MNQ recording of October 14–15, 2026:
- Trades: 8,526 executions for 184,492 contracts (a partial two-day sample from our recorder, not a full session), each with price, size and aggressor side.
- Depth: the resting bids and offers on at least 10 price levels on each side, refreshed on every change.
- Aggressor side: reported by the exchange on 100% of trades, so delta is computed, not inferred.
Order flow describes what is happening now, not what happens next. It is a confirmation and timing tool for a plan you already have, not a signal generator.
Your decision: before you add any order flow tool, write down the one question you want it to answer (where is the big resting size, who is aggressive now, is the wall holding). A tool that answers none of these is decoration.
Why does the first hour decide most of the day?
Because on MNQ the first hour of the regular session (9:30–10:30 ET) carries a median 34% of the whole day’s volume and already covers a median 75% of the day’s high-to-low range. We measured it on 29 complete regular sessions recorded between August 20 and October 15, 2026. The same hour on ES carries 24.5% of volume and 58% of the range. If you trade order flow, this is where the information density is highest and where a 1-minute candle is 2.6 times larger than at lunch.
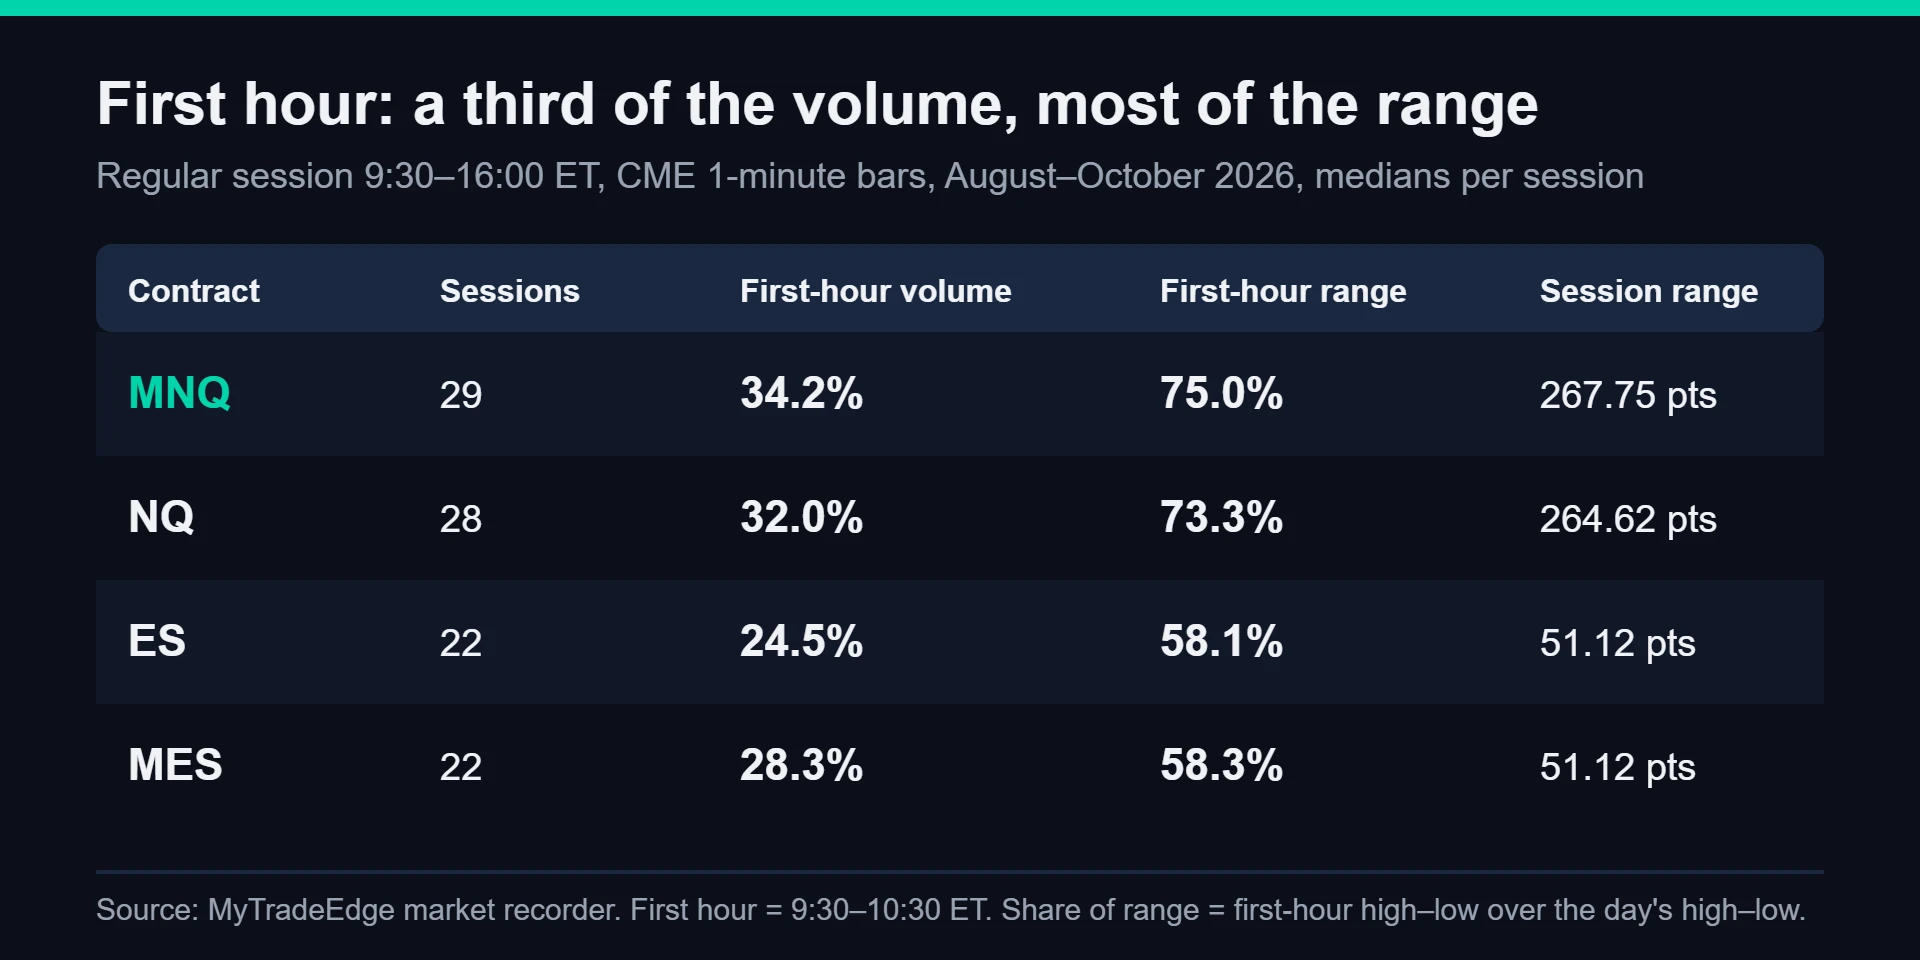
| Contract | Sessions measured | First-hour share of volume (median) | First-hour share of day’s range (median) | Median session range |
|---|---|---|---|---|
| MNQ | 29 | 34.2% | 75.0% | 267.75 points |
| NQ | 28 | 32.0% | 73.3% | 264.62 points |
| ES | 22 | 24.5% | 58.1% | 51.12 points |
| MES | 22 | 28.3% | 58.3% | 51.12 points |
Source: MyTradeEdge market recorder, CME 1-minute bars, regular session 9:30–16:00 ET, August–October 2026.
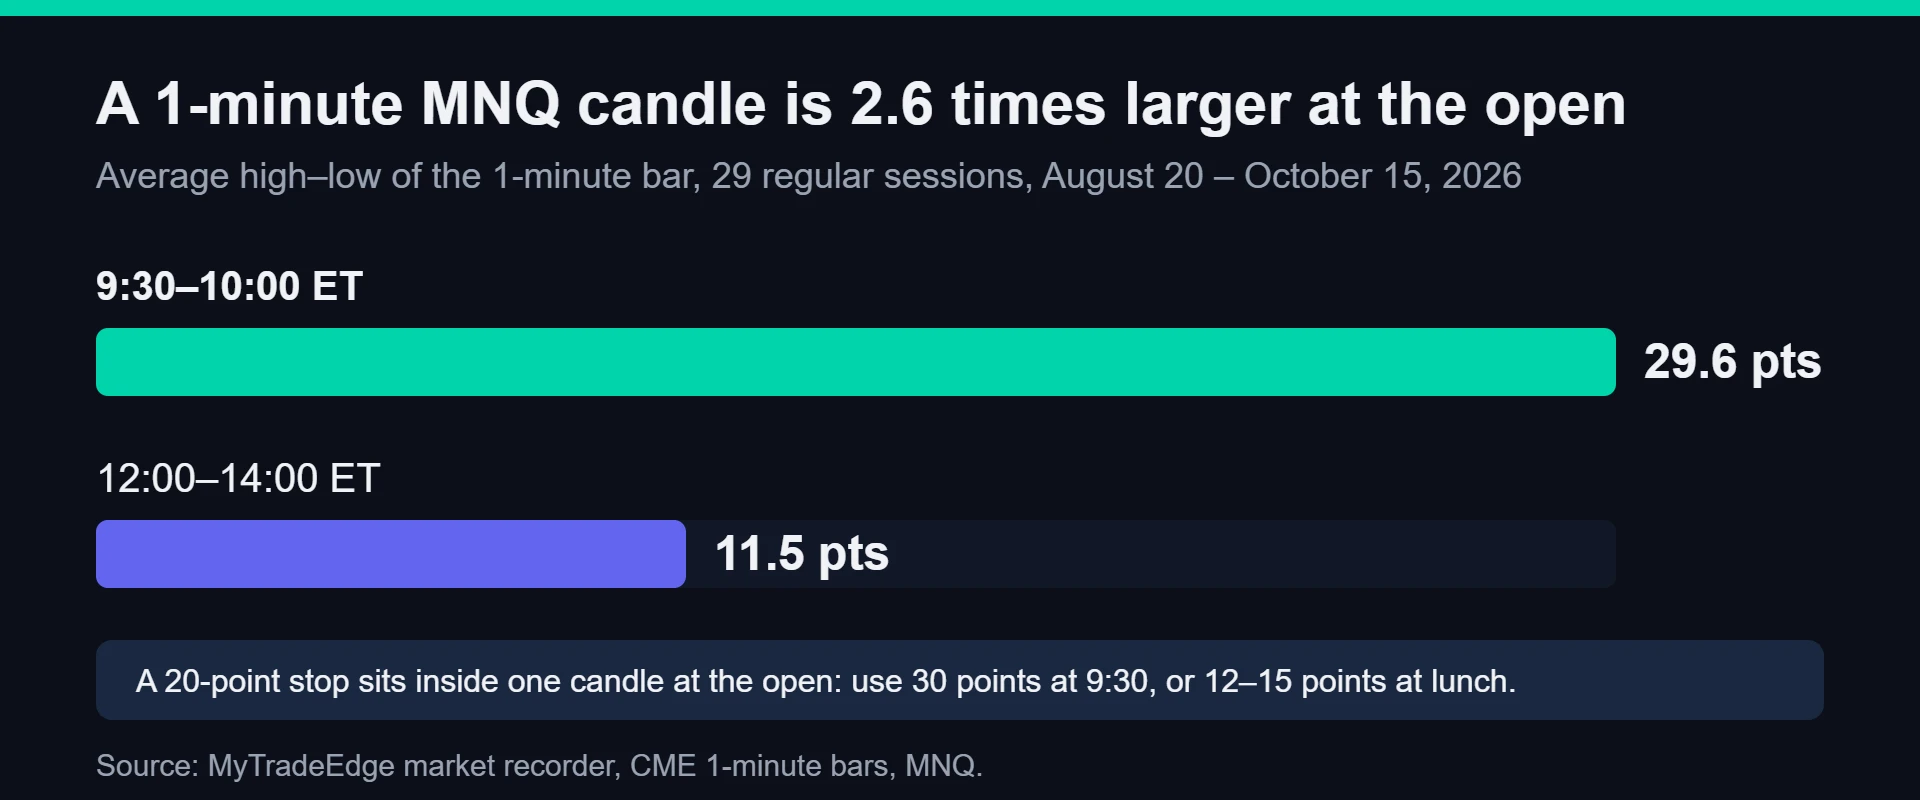
The candle size tells the same story. On MNQ, the average 1-minute candle between 9:30 and 10:00 ET spans 29.6 points; between 12:00 and 14:00 ET it spans 11.5 points. A 20-point stop that is comfortable at lunch is inside the noise of a single candle at the open.
Your decision: size your stop by the hour, not by habit. At the open on MNQ use a stop of at least one average candle (30 points) and fewer contracts; at lunch, 12–15 points covers a candle, and the same dollar risk buys twice the contracts.
How do you read the DOM (depth of market)?
The DOM is a price ladder with the resting bids below and the resting offers above the last trade. You read three things on it: where the unusually large sizes sit, whether they stay when price gets close, and whether they get filled or pulled. “Unusually large” is relative to the instrument and the session: take the median print size from your own tape for that session, and treat a resting order of ten times that size or more as large.
The four things to read on the DOM, in order of importance:
- Absorption: price reaches the large size, trades execute into it (you see them on the tape and in the footprint), and the size stays while price fails to go through. Someone is taking the other side of the aggression. This is the strongest reversal signal order flow gives you.
- Pulling: the large size vanishes before price touches it. There was no intention behind it. Expect continuation through the level.
- Iceberg: the displayed size at one price gets consumed and reappears at the same size, three or four times in a row. The visible 20 contracts can hide hundreds.
- Stacking: several large sizes appear on the same side within 2–3 ticks of each other as price approaches. Stacked bids are a floor until they are not; watch whether they pull together.
A working threshold for “large”: 10 times the session’s median print on the same contract, measured on your own tape.
Your decision: do not trade a level because it is big. Trade it after you have seen it tested at least once and it either absorbed or pulled.
How do you read the tape (time and sales)?
The tape lists every trade: time, price, size, and whether it hit the bid or lifted the offer. Unfiltered, it is unreadable at the open. Filter it by size, and set the filter from the instrument’s own distribution: on MNQ, trades of 20 or more contracts carried 53% of the session’s volume in our October 14–15 recording, so a 20-contract filter shows you half the volume in a fraction of the prints. On NQ and ES the same role is played by 100 contracts and up.
What you look for on the filtered tape:
- Speed: prints arriving faster at one price than anywhere else in the last few minutes. Speed with no price progress is absorption; speed with price progress is a sweep.
- Repeated size at one price: the same 20, 30 or 50 lots printing again and again at a level is the tape view of an iceberg.
- Big prints against the move: a 500-lot hitting the bid while price makes a new high is the tape view of delta divergence. Prints far above the session median are rare and worth a note in the journal.
Your decision: set the tape filter at roughly the session’s median print on your contract, and raise it if the tape scrolls too fast to read.
How do you read a footprint chart?
A footprint splits each candle into price levels and shows, at every level, the volume that traded at the bid (aggressive sellers) and at the ask (aggressive buyers). Read it diagonally: the ask volume at one price against the bid volume one tick below. An imbalance is when one side is at least three times the other. Three or more imbalances stacked on consecutive prices mark a level that aggressive traders defended, and that level tends to act as support or resistance on the next test.
The three footprint patterns worth trading:
- Stacked imbalances with price progress: aggressive buyers at 3:1 on three consecutive levels and price moving up. Continuation; the imbalance levels are your stop reference.
- High volume at the extreme with no progress: 1,200 contracts at the candle’s low and the candle closes above it. Absorption at the low; reversal candidate.
- Unfinished auction: the candle’s high or low has volume on both bid and ask (no zero on one side). The market usually comes back to finish it, which gives you a target.
Footprints need tick data and a platform that builds them; the full mechanics, including how to set the imbalance ratio and what a delta-colored footprint adds, are in our footprint chart guide.
Your decision: use one imbalance ratio (3:1) and one minimum of stacked levels (3) for a month before you change anything. The patterns only mean something if the definition stays fixed.
What do delta and cumulative delta tell you?
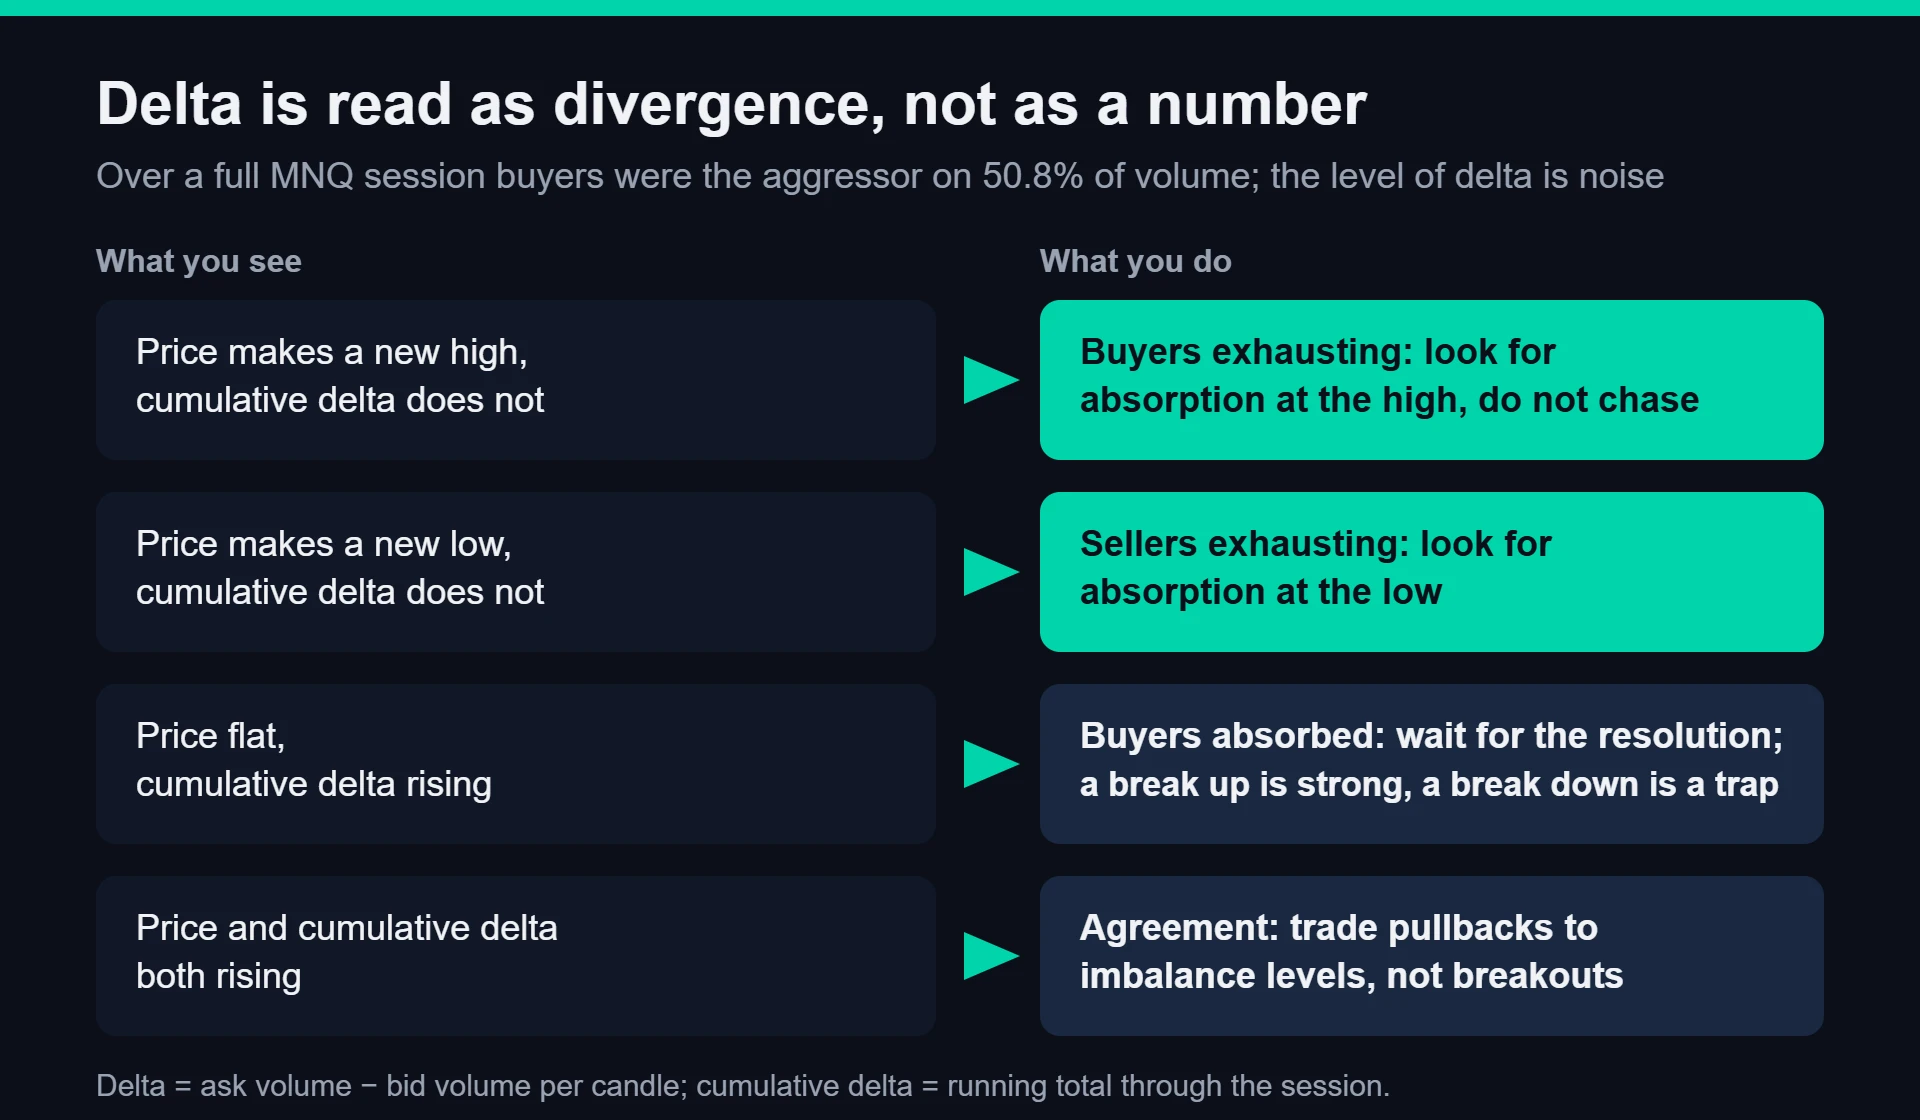
Delta is ask volume minus bid volume for a candle: how much more the aggressive buyers did than the aggressive sellers. Cumulative delta (CVD) is the running total through the session. The number itself is small relative to volume: across our recorded MNQ sample, buyers were the aggressor on 50.8% of volume and sellers on 49.2%, so delta is a small net of two large flows. That is why the level of delta is noise and the divergence between delta and price is the signal.
| What you see | What it means | What you do |
|---|---|---|
| Price makes a new high, cumulative delta does not | buyers are exhausting; the high was made on fewer aggressive contracts | look for absorption at the high, do not chase |
| Price makes a new low, cumulative delta does not | sellers are exhausting | look for absorption at the low |
| Price flat, cumulative delta rising | buyers are aggressive and someone absorbs them | wait for the resolution; a break up is strong, a break down is a trap for the buyers |
| Price and cumulative delta both rising | agreement; continuation | trade pullbacks to imbalance levels, not breakouts |
Source: the four delta situations as we tag them in the journal; the delta formula is ask volume minus bid volume.
Your decision: put cumulative delta under the chart, mark every divergence with a vertical line for a week, and count how many resolved against price. If fewer than half did, the problem is your instrument or your session, not the tool.
Absorption and exhaustion: the two events worth waiting for
Absorption is aggression that fails to move price; exhaustion is a move that runs out of aggression. Both show up on all four tools at once, and that is how you confirm them: the DOM size holds, the tape prints into it at speed, the footprint shows high volume at the extreme with no progress, and cumulative delta diverges from price. One tool alone gives you a guess; three out of four give you a trade.
The working checklist before you click:
- the level existed before the session (prior day high or low, overnight high or low, value area edge), not a level you drew after the fact;
- at least one test of the level with visible absorption or pulling on the DOM;
- a footprint candle at the level with volume at the extreme and no price progress;
- cumulative delta divergence on the same test;
- a stop beyond the absorption candle, not beyond the level, which on MNQ at the open is 20–30 points, or $40–60 per contract;
- a first target at the last imbalance cluster or the unfinished auction, usually 40–60 points on MNQ, so the trade pays 2 to 1 or better.
Your decision: if fewer than four boxes are checked, there is no trade. Write the setup down anyway; the missed ones teach you the checklist.
How much do you risk per trade on a funded account?
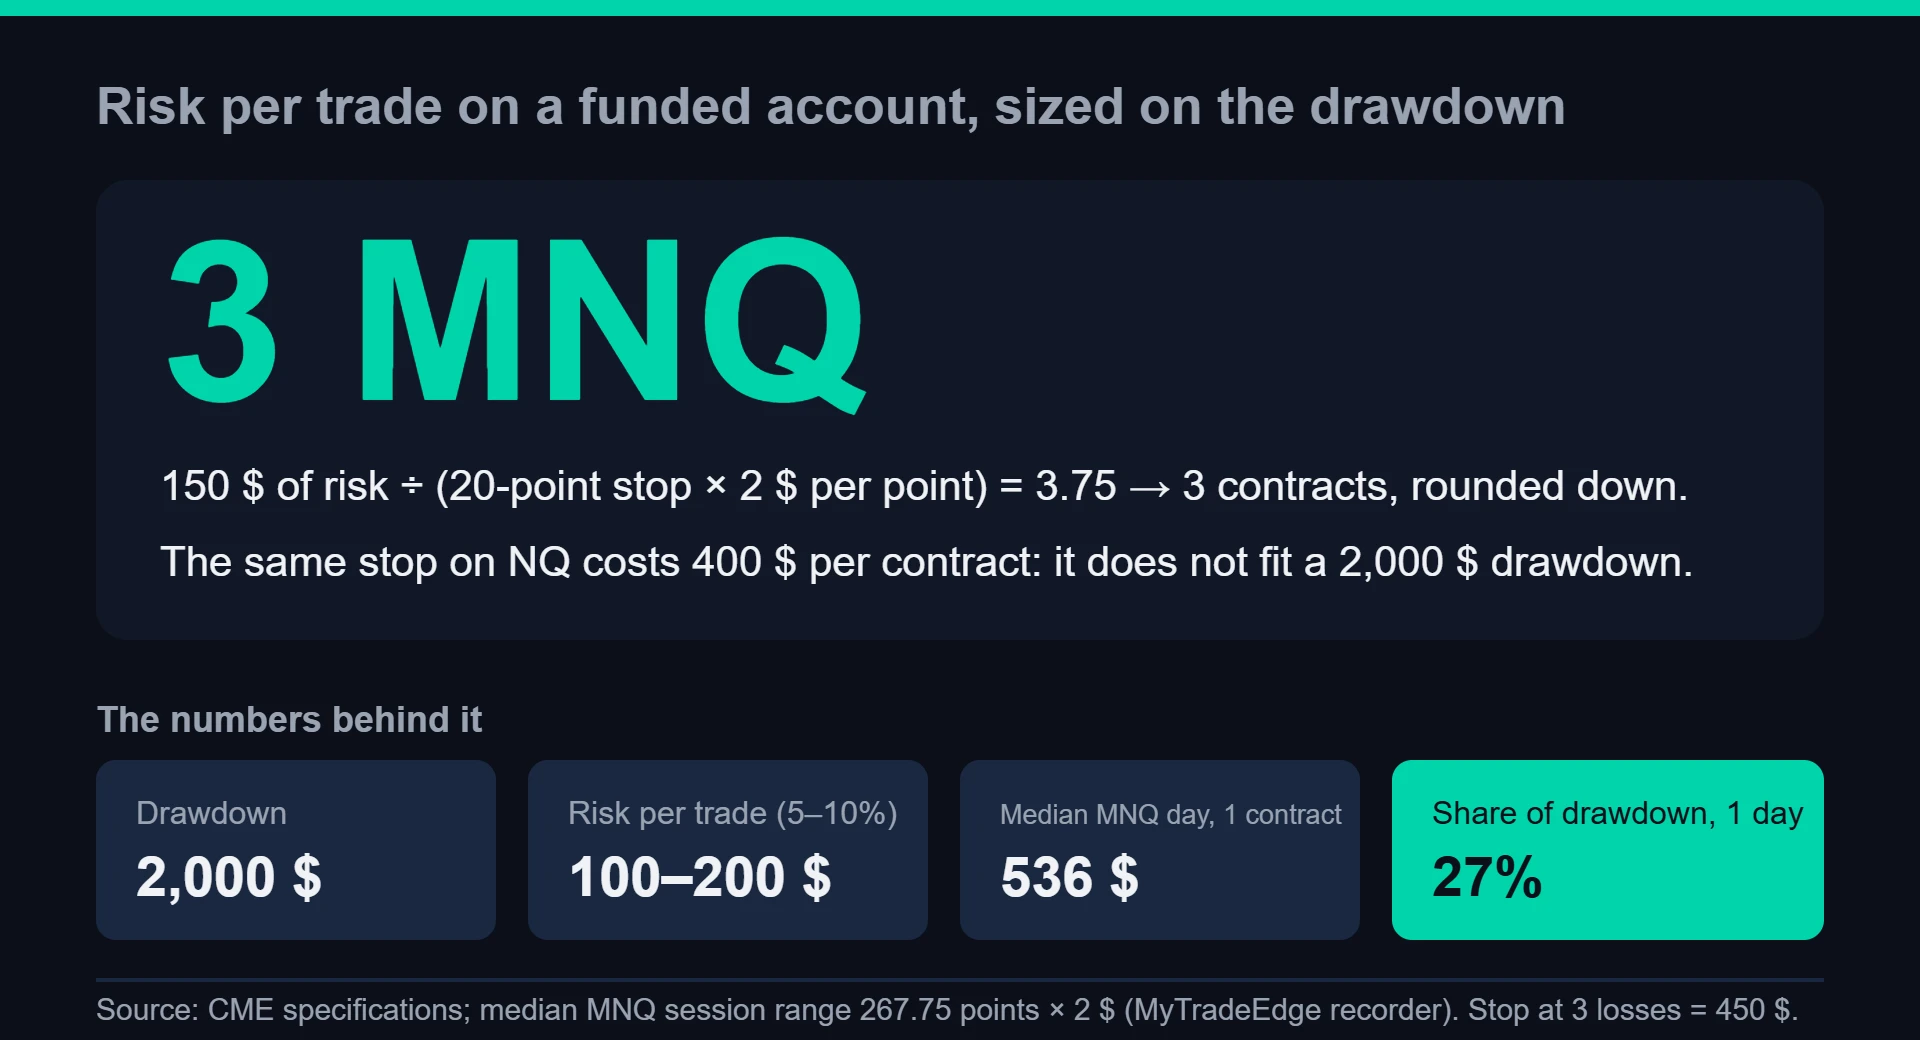
Between 5% and 10% of the drawdown you have left, not a percentage of the balance the firm displays. On a $50,000 evaluation with a $2,000 trailing drawdown that is $100–200 per trade, and the number of contracts follows from the stop: with a 20-point stop on MNQ ($2 per point) one contract costs $40 if it is hit, so $150 of risk buys 150 ÷ 40 = 3.75, rounded down to 3 contracts. The same stop on NQ ($20 per point) costs $400 and does not fit the budget.
| Contract | Point value | Tick value (0.25 pt) | Median session range, in dollars per contract |
|---|---|---|---|
| NQ | $20 | $5 | $5,292 |
| MNQ | $2 | $0.50 | $536 |
| ES | $50 | $12.50 | $2,556 |
| MES | $5 | $1.25 | $256 |
Source: CME contract specifications; median session ranges from the table above (MNQ 267.75 points × $2, ES 51.12 points × $50).
Why the session range matters for sizing: one MNQ contract held through a median day moves $536, which is 27% of a $2,000 drawdown. Three contracts held through an adverse half-day can erase 40% of the drawdown. Order flow entries are precise, so the stop can be tight; the position size still has to survive a day you read wrong.
A second limit, the daily one: if the firm’s daily loss limit is $1,000 and you risk $150 per trade, the seventh consecutive loss ends your day. Set your own stop at three losses ($450) and stop before the firm stops you.
Your decision: use the calculator below with your remaining drawdown, your stop in points and the contract. Then log every trade with its setup tag in the MyTradeEdge journal: it carries the rule presets for Apex, Topstep, The5ers, FundedNext and MyFundedFutures and warns you before you hit a limit, and the free plan covers 50 trades a month.
How much do you risk per trade on a funded account?
Risk is sized on the drawdown you have left, not on the displayed balance. Contracts are rounded down.
Contract values from CME specifications: NQ $20/point ($5/tick), MNQ $2/point ($0.50/tick), ES $50/point, MES $5/point. Median session ranges from the MyTradeEdge recorder (MNQ 267.75, NQ 264.62, ES/MES 51.12 points). The MyTradeEdge journal tracks drawdown and daily limits on your firm’s presets.
What data and software do you need, and what does it cost?
You need tick-level trade data with the aggressor side, depth-of-market data with at least 10 levels, and a platform that builds footprints and cumulative delta from them. Candle data from a charting website is not enough: without the side of each trade there is no delta, and without depth there is no DOM. CME sells market data in three levels (top of book, market depth, and market by order, which shows every individual order in the queue) and the depth level is what footprints and DOM reading need.
What the setup is made of:
- A data subscription for the CME equity index group, at the depth level; priced per month by the exchange and passed through by your data provider.
- A platform that builds footprints, cumulative delta and a DOM from the feed; several do, and the right one is the one whose default thresholds you can change per instrument.
- Replay: a way to replay recorded sessions bar by bar. Absorption and pulling cannot be learned from screenshots; you have to watch the DOM move.
- A journal with setup tags so that “absorption at prior day low” becomes a row you can filter and measure after 50 trades.
Our own stack: the market recorder that produced the numbers in this article captures CME trades and depth continuously and feeds TradingChart, our order flow chart with footprint, heatmap and DOM; the journal and the backtest engine use the same contract specifications. The journal is free for 50 trades a month; single apps are $9 a month, Pro is $19 and all apps together are $29.
Your decision: before paying for any platform, ask whether its tape and footprint thresholds can be set per instrument. A “100 contracts” filter is right on NQ and shows nothing on MNQ, and a platform that cannot change it will make you think the feature is broken.
Which mistakes cost order flow beginners the most?
Reading the DOM without the tape, trading a level because it is large, and sizing by the displayed balance instead of the drawdown. Each one is a mistake of context: the tool is fine, the question asked of it is wrong.
- Trading the size, not the behavior: a 300-lot bid is information only after it has been tested. Before that it is a number that can be pulled.
- Delta as a level: +1,500 on a candle means nothing without the candle’s volume and the session’s typical delta. Use divergence and the four situations above.
- Same thresholds on every instrument: 20 contracts is a big print on MNQ and nothing on ES. Set the filters from the distribution, as in the tape section.
- Lunch trades with opening-hour stops: at 12:00–14:00 ET the MNQ candle is 11.5 points; a 30-point stop is three candles of noise, $60 per contract, and a 30-point target can take an hour to reach.
- No replay, no journal: the patterns are visual and fast. Without replay you never see enough of them; without tags you cannot tell which one works for you.
- Hedging across prop accounts: on at least one large firm all US index contracts count as one instrument across all your accounts; being long on one and short on another breaks the rule.
Your decision: pick one instrument (MNQ), one session window (9:30–11:00 ET), one setup (absorption at a pre-existing level) and 50 trades in the journal before you add anything else.
Frequently asked questions
What is order flow in futures trading?
The record of executed trades with their size and aggressor side, plus the limit orders resting in the book. You read it with the DOM, the tape, the footprint chart and delta to see who is aggressive, where the large resting size is, and whether a level is being absorbed or pulled.
Is order flow only for scalping?
No. The tools are intraday, but the levels you apply them to can come from any timeframe. Most futures traders use order flow to time entries at daily levels, with stops of 20–30 points on MNQ and holds of minutes to hours.
Do I need Level 2 data?
For the DOM and footprints, yes: you need trades with the aggressor side and market depth. Candle data alone gives you volume per bar but no delta and no book.
What is a good delta?
There is no good number. In our recorded MNQ sample buyers were the aggressor on 50.8% of volume, so delta is a small net of two large flows. Read the divergence between cumulative delta and price, not the level.
How big should my tape filter be?
From the instrument’s distribution. On MNQ, trades of 20 or more contracts carried 53% of session volume in our recording; on NQ and ES use 100 or more.
Can order flow be automated?
Partly. Imbalances, delta divergence and sweeps can be detected by code and sent as signals; absorption at a specific level still needs context from the trader. Our Autotrader takes webhook signals and order flow triggers and routes them to prop accounts with risk limits.
When is the best time to trade order flow on NQ?
The first hour of the regular session: 9:30–10:30 ET carries a median 34% of MNQ volume (32% on NQ) and 75% of the day’s range in our recordings. Lunch (12:00–14:00 ET) has candles 2.6 times smaller and far fewer readable events.
Sources
- MyTradeEdge market recorder: CME 1-minute bars for MNQ (29 regular sessions, Aug 20 – Oct 15, 2026), NQ (28), ES and MES (22 each); MNQ trade log of Oct 14–15, 2026 (8,526 trades, 184,492 contracts, aggressor side reported by the exchange). Computed Oct 15, 2026.
- MyTradeEdge: Footprint chart explained, NQ contract: tick value, NQ vs MNQ, sizing, How to keep a futures trading journal, VWAP trading for NQ and ES, Journal, Pricing
- CME Group: E-mini Nasdaq-100 contract specifications, Micro E-mini Nasdaq-100, Market data: Market by Order