This study measures how the first 30 minutes of the regular session in E-mini Nasdaq-100 futures (NQ) relate to the rest of the day: how wide the opening range is, which side breaks first, and where the session closes. It uses 38 regular sessions from Jul 28, 2026 to Oct 22, 2026, recorded by MyTradeEdge from the live Rithmic market data feed. The per-session results can be downloaded as a CSV file at the end of the page.
Data updated: October 23, 2026. We plan to refresh the figures once a month with the new sessions.
Summary of the results
| Measure (38 sessions) | Result |
|---|---|
| Typical 30-minute opening range (9:30-10:00) | 162.62 points |
| Typical 15-minute opening range (9:30-9:45) | 141.38 points |
| Typical full-session range (9:30-16:00) | 295.12 points |
| Typical share of the session range already covered by 10:00 | 58.2% |
| Sessions that traded beyond the opening range on at least one side | 38 of 38 |
| Sessions that traded beyond both sides | 15 of 38 (39%) |
| First break above / below | 21 / 17 |
| First break before 10:30 | 36 of 38 (95%) |
| Session closed beyond the side that broke first | 16 of 38 (42%) |
| Session closed back inside the opening range | 18 of 38 (47%) |
| Session closed beyond the opposite side | 4 of 38 (11%) |
“Typical” means the middle value: half of the sessions were below it and half above.
What the numbers say
The opening range is a large part of the day. By 10:00 New York time, NQ had already covered 58.2% of its full-session high-low range in a typical session. An opening range of about 162.62 points against a session range of about 295.12 points leaves a little over 40% of the day’s range for the rest of the session.
A break happened every day, and usually early. In all 38 sessions, price traded beyond the opening range at least once, and in 36 of them the first break came before 10:30. In a typical session the first break came 10 minutes after the range closed. A break on its own is therefore not a rare event that needs to be waited for.
The first break was not a reliable direction signal. Only 16 of 38 sessions (42%) closed beyond the side that broke first. 18 sessions (47%) closed back inside the opening range, and 4 closed beyond the opposite side. In 15 sessions (39%), price broke both sides during the day. After the first break, price went on to trade a typical 94.12 points beyond that side of the range at its furthest point.
Range width made a difference in this sample. In the 19 sessions with the narrowest opening ranges (up to 161.5 points), 6 closed beyond the side that broke first. In the 19 sessions with the widest ranges (from 163.75 points), 10 did. With samples this small, treat that difference as something to test on your own data, not as a rule.
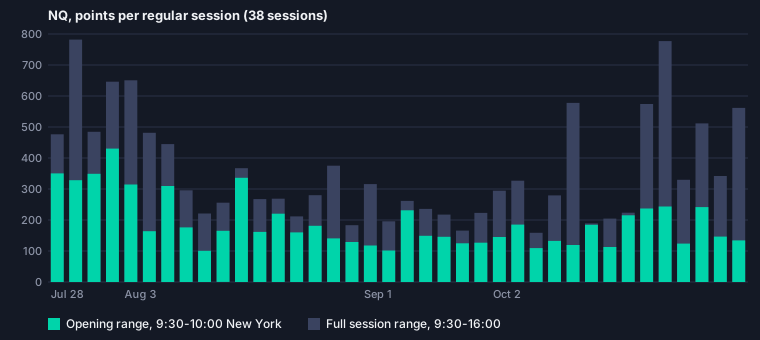
What was measured
- Instrument: NQ, the front-month E-mini Nasdaq-100 futures contract on CME Globex. Prices are as traded, in index points, with no back-adjustment for the September roll.
- Regular session: 9:30 to 16:00 New York time, 390 one-minute bars.
- Opening range: the highest high and lowest low of the first 30 one-minute bars (9:30 to 9:59). The 15-minute range uses the first 15 bars.
- Break: a later one-minute bar in the regular session trades above the opening range high or below its low. The first break is the side that was traded through first.
- Close: the close of the last one-minute bar of the regular session, compared with the opening range high and low.
Where the data come from
The data are MyTradeEdge’s own recordings. The market data gateway that runs alongside the MyTradeEdge TradingChart platform receives the live NQ feed through Rithmic and stores one-minute bars (open, high, low, close, volume). No vendor statistics were used. The same calculation was run separately on the Micro E-mini Nasdaq-100 (MNQ) feed as a check: over 39 MNQ sessions, the typical opening range was 160.75 points and covered 59.9% of the session range, close to the NQ figures.
The calculation script is plain Python and uses only the one-minute bars. You can recompute every figure on this page from the CSV file below.
Which sessions are included
A session was included only if all 30 opening-range minutes and at least 389 of the 390 regular-session minutes were recorded, and if the recorded volume was at least 60% of the typical session volume. The volume test catches days when bars were stored but part of the trade feed was missing. Weekdays between Jul 28, 2026 and Oct 22, 2026 that are not in the table:
- Incomplete recording of the session or the opening range: Aug 4, 2026, Aug 25, 2026, Sep 3, 2026, Sep 4, 2026, Sep 18, 2026, Sep 29, 2026, Oct 1, 2026, Oct 14, 2026.
- Recorded volume too low (incomplete trade feed): Sep 14, 2026, Sep 15, 2026, Sep 16, 2026, Sep 17, 2026.
- No recording for the day: August 10 to 14, August 24, and September 21 to 28, 2026.
- September 7, 2026: Labor Day, US stock market holiday.
Limits of this study
- One contract, one period. The results describe NQ from Jul 28, 2026 to Oct 22, 2026. They are not a forecast and are not a trading strategy.
- Small sample. 38 sessions are enough to describe this period, not to establish a rule. A few sessions moving from one group to another changes the percentages by several points.
- One-minute resolution. If a bar traded through both sides of the range, the order inside that minute is not known. That did not happen at the first break in this sample.
- No costs, no entries. The study describes price behaviour. It does not simulate orders, commissions or slippage.
- Recording gaps. Our recordings can miss data. Sessions with detected gaps were removed; an undetected gap could still affect a session in the table.
Download the data
nq-opening-range-sessions.csv (38 rows, one per session). Columns: session date, minutes recorded, open, high, low and close of the regular session, session range, 15- and 30-minute opening range, opening range high and low, which sides broke, the first break and its time (New York), where the session closed relative to the range, how far price traded beyond each side, and recorded volume. It contains results per session, not tick data. You may reuse it with a link to this page.
Test an opening range rule yourself
The MyTradeEdge backtest app includes opening range breakout strategies with an opening range size filter, and runs them on futures price bars you upload as CSV files. For the first hour of MNQ volume and range, see our MNQ first-hour study.
Per-session values
Times are New York time. Ranges are in index points.
| Session | Opening range | Session range | Share | First break | Close vs range |
|---|---|---|---|---|---|
| Tue, Jul 28, 2026 | 350.25 | 476.50 | 73.5% | Below at 10:14 | Inside |
| Wed, Jul 29, 2026 | 328.25 | 782.00 | 42.0% | Below at 10:12 | Below |
| Thu, Jul 30, 2026 | 349.00 | 484.50 | 72.0% | Above at 10:01 | Above |
| Fri, Jul 31, 2026 | 430.25 | 646.00 | 66.6% | Below at 10:01 | Inside |
| Mon, Aug 3, 2026 | 314.50 | 650.75 | 48.3% | Above at 10:18 | Above |
| Wed, Aug 5, 2026 | 163.75 | 481.25 | 34.0% | Below at 10:23 | Below |
| Thu, Aug 6, 2026 | 309.75 | 445.00 | 69.6% | Above at 10:01 | Inside |
| Fri, Aug 7, 2026 | 176.25 | 295.75 | 59.6% | Below at 10:02 | Above |
| Mon, Aug 17, 2026 | 100.50 | 221.00 | 45.5% | Below at 10:08 | Below |
| Tue, Aug 18, 2026 | 165.00 | 255.75 | 64.5% | Below at 10:10 | Below |
| Wed, Aug 19, 2026 | 336.25 | 367.00 | 91.6% | Below at 10:11 | Inside |
| Thu, Aug 20, 2026 | 161.50 | 267.50 | 60.4% | Below at 10:20 | Below |
| Fri, Aug 21, 2026 | 220.25 | 268.75 | 82.0% | Below at 10:14 | Inside |
| Wed, Aug 26, 2026 | 160.00 | 211.50 | 75.7% | Below at 10:27 | Inside |
| Thu, Aug 27, 2026 | 181.25 | 280.00 | 64.7% | Above at 10:27 | Above |
| Fri, Aug 28, 2026 | 140.50 | 375.25 | 37.4% | Above at 10:00 | Below |
| Mon, Aug 31, 2026 | 129.00 | 183.25 | 70.4% | Below at 10:06 | Inside |
| Tue, Sep 1, 2026 | 117.75 | 315.75 | 37.3% | Above at 10:09 | Inside |
| Wed, Sep 2, 2026 | 101.75 | 195.75 | 52.0% | Above at 10:10 | Above |
| Tue, Sep 8, 2026 | 231.25 | 261.75 | 88.3% | Below at 10:02 | Inside |
| Wed, Sep 9, 2026 | 149.00 | 235.75 | 63.2% | Above at 10:04 | Inside |
| Thu, Sep 10, 2026 | 145.75 | 217.50 | 67.0% | Above at 10:30 | Inside |
| Fri, Sep 11, 2026 | 124.75 | 165.75 | 75.3% | Above at 10:12 | Inside |
| Wed, Sep 30, 2026 | 126.75 | 223.00 | 56.8% | Above at 10:31 | Inside |
| Fri, Oct 2, 2026 | 145.25 | 294.50 | 49.3% | Above at 10:01 | Inside |
| Mon, Oct 5, 2026 | 185.25 | 326.75 | 56.7% | Above at 10:22 | Above |
| Tue, Oct 6, 2026 | 109.25 | 158.75 | 68.8% | Above at 10:07 | Inside |
| Wed, Oct 7, 2026 | 132.50 | 279.25 | 47.4% | Above at 10:25 | Above |
| Thu, Oct 8, 2026 | 119.25 | 577.75 | 20.6% | Above at 10:18 | Below |
| Fri, Oct 9, 2026 | 184.50 | 189.00 | 97.6% | Below at 10:11 | Inside |
| Mon, Oct 12, 2026 | 112.75 | 204.50 | 55.1% | Below at 10:05 | Below |
| Tue, Oct 13, 2026 | 215.00 | 223.50 | 96.2% | Above at 10:01 | Inside |
| Thu, Oct 15, 2026 | 237.00 | 574.25 | 41.3% | Above at 10:10 | Above |
| Fri, Oct 16, 2026 | 243.50 | 777.00 | 31.3% | Below at 10:10 | Below |
| Mon, Oct 19, 2026 | 123.75 | 329.75 | 37.5% | Below at 10:01 | Inside |
| Tue, Oct 20, 2026 | 241.50 | 511.75 | 47.2% | Above at 10:00 | Above |
| Wed, Oct 21, 2026 | 146.50 | 342.00 | 42.8% | Above at 10:02 | Above |
| Thu, Oct 22, 2026 | 134.25 | 561.75 | 23.9% | Above at 10:01 | Below |