A trading journal is a record of every trade you take, written so you can measure it later: what you traded, why, how much you risked, how it ended and whether you followed your own rules. For futures traders on NQ, ES and their micros, a useful journal needs about 12 fields per trade and a 30-minute review once a week. Everything else is decoration.
Most guides to trading journaling are written for stocks or forex. Futures have their own details that change the numbers: contract months, tick values, round-turn fees and, for many traders, a prop firm drawdown that ends the account if you ignore it. This guide covers what to log, which four metrics to calculate, and how to turn the log into one concrete change per week.
What is a trading journal, and why do futures traders need one?
A trading journal turns memory into data. Memory keeps the big win and the painful loss; a log keeps the 40 ordinary trades in between, which are the ones that decide whether your method makes money.
For futures day traders the case is stronger than for investors. You may take 3 to 10 trades a day on NQ or MNQ, each one with a different setup, size and time of day. After a month that is 100+ trades. Without a trading log you cannot answer basic questions such as “do I make money in the first hour or lose it after lunch?” or “is my best setup still working this quarter?”.
If you trade a funded or evaluation account, the journal is also your risk dashboard. Daily loss limits and trailing drawdowns are measured in dollars, while your stops are measured in points. The journal is where the two meet.
What should you record for every trade?
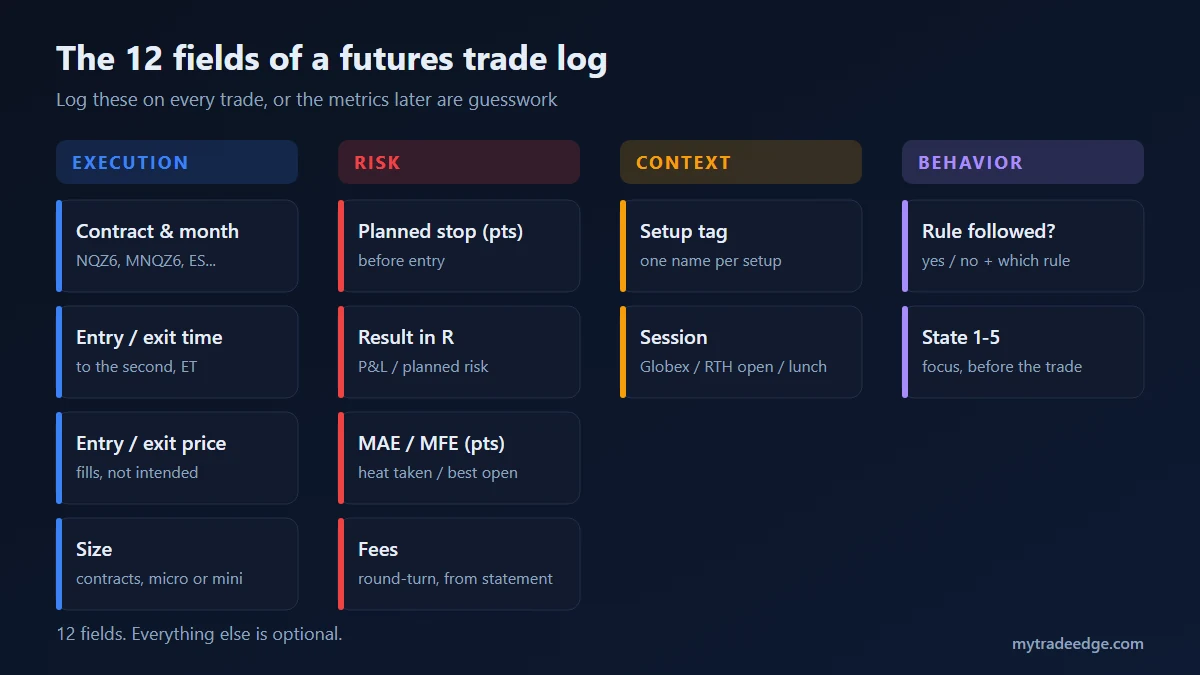
Record 12 fields: four for execution, four for risk, two for context and two for behavior. That is enough to calculate every metric that matters, and small enough that you will still be filling it in after three months.
Execution: what actually happened
- Contract and month. Write the full symbol, for example NQZ6 or MNQZ6, not just “Nasdaq”. Around the quarterly roll you may hold the old and new month on the same day, and the two do not trade at the same price.
- Entry and exit time. To the second, in one time zone. Eastern Time is the practical choice because the cash open (9:30 ET) and the economic calendar use it.
- Entry and exit price. The fills from your platform, not the price you intended. The gap between the two is slippage, and it is a cost.
- Size. Number of contracts and whether they are E-mini or micro. One NQ moves $20 per point; one MNQ moves $2 per point (CME Group contract specs).
Risk: how much was on the line
- Planned stop in points. Write it before you enter. If you cannot name the stop before the trade, that is the first finding of your journal.
- Result in R. Profit or loss divided by the planned risk. A $150 win on a trade that risked $100 is +1.5R. R lets you compare a 1-lot MNQ trade with a 2-lot NQ trade.
- MAE and MFE. Maximum adverse excursion (how far price went against you) and maximum favorable excursion (the best open profit). They show whether your stops are too tight and whether your targets leave money on the table.
- Fees. Round-turn commissions plus exchange and clearing fees, copied from your statement. On micros, fees are a much larger share of a small win than on E-minis.
Context: what kind of trade it was
- Setup tag. One short name per setup from your playbook, such as “VWAP pullback” or “opening range break”. Keep the list short; 4 to 6 tags is plenty.
- Session. Overnight (Globex), regular-hours open, midday or close. Index futures behave very differently around 9:30 ET than at 12:30 ET.
Behavior: did you follow your process?
- Rule followed? (yes/no + which rule). The most valuable field in the whole journal. It separates “the setup does not work” from “I did not take the setup”.
- State, 1 to 5. A quick score of focus before the trade. After 50 trades you will usually see a pattern.
Screenshots are useful but optional. A chart image with the entry and exit marked takes 10 seconds and helps the weekly review a lot.
Which metrics should a trading journal calculate?
Four numbers are enough to judge a method: win rate, average win versus average loss, expectancy, and profit factor. Win rate on its own is misleading; it only makes sense next to the size of wins and losses.
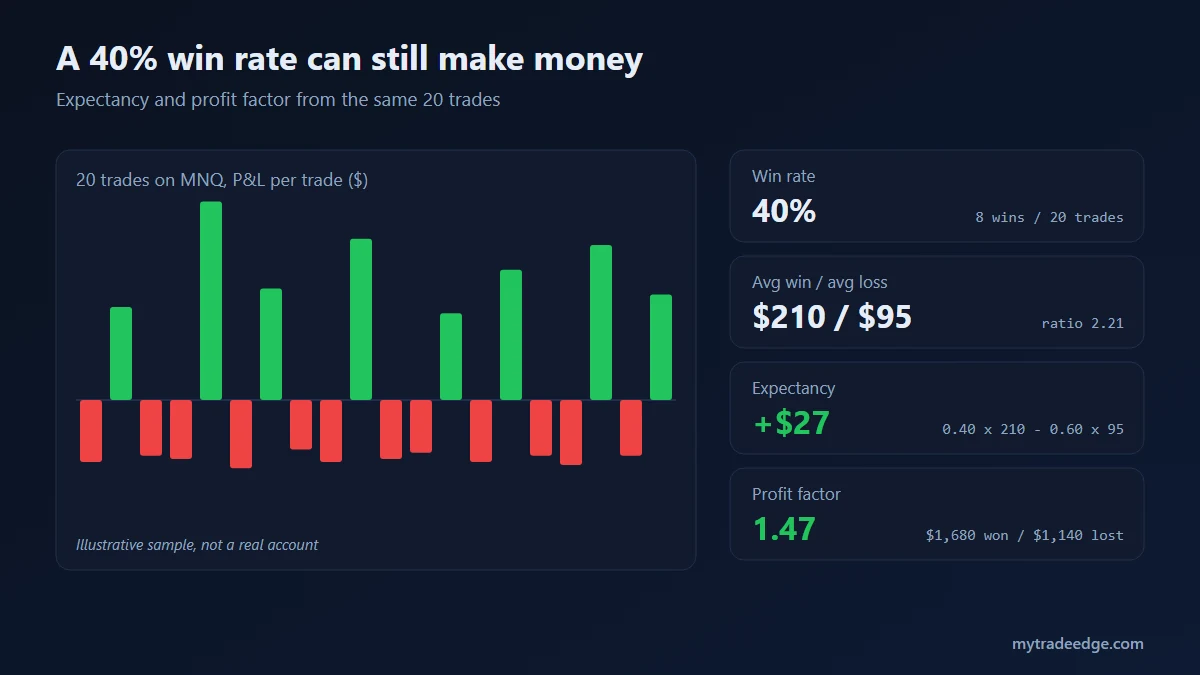
Take the 20 example trades in the chart above (an illustrative sample, not a real account):
| Metric | Formula | Example result |
|---|---|---|
| Win rate | winning trades / all trades | 8 / 20 = 40% |
| Average win / average loss | total won / wins; total lost / losses | $210 / $95 |
| Expectancy per trade | (win rate x avg win) – (loss rate x avg loss) | 0.40 x 210 – 0.60 x 95 = +$27 |
| Profit factor | gross profit / gross loss | $1,680 / $1,140 = 1.47 |
This trader loses more often than they win and still makes $540 over 20 trades, because the average win is 2.2 times the average loss. The reverse also happens: a 70% win rate with small wins and large losses can lose money. That is why “calculate win rate” is only the first step.
Two practical notes. First, calculate expectancy net of fees, or it will look better than your account statement. Second, judge a setup on at least 30 to 50 trades of that tag. Ten trades tell you very little.
How do you review a trading journal each week?
Block 30 minutes at the end of the week and follow the same four steps: complete the log, tag every trade, measure expectancy by tag and by session, and change exactly one rule for next week.
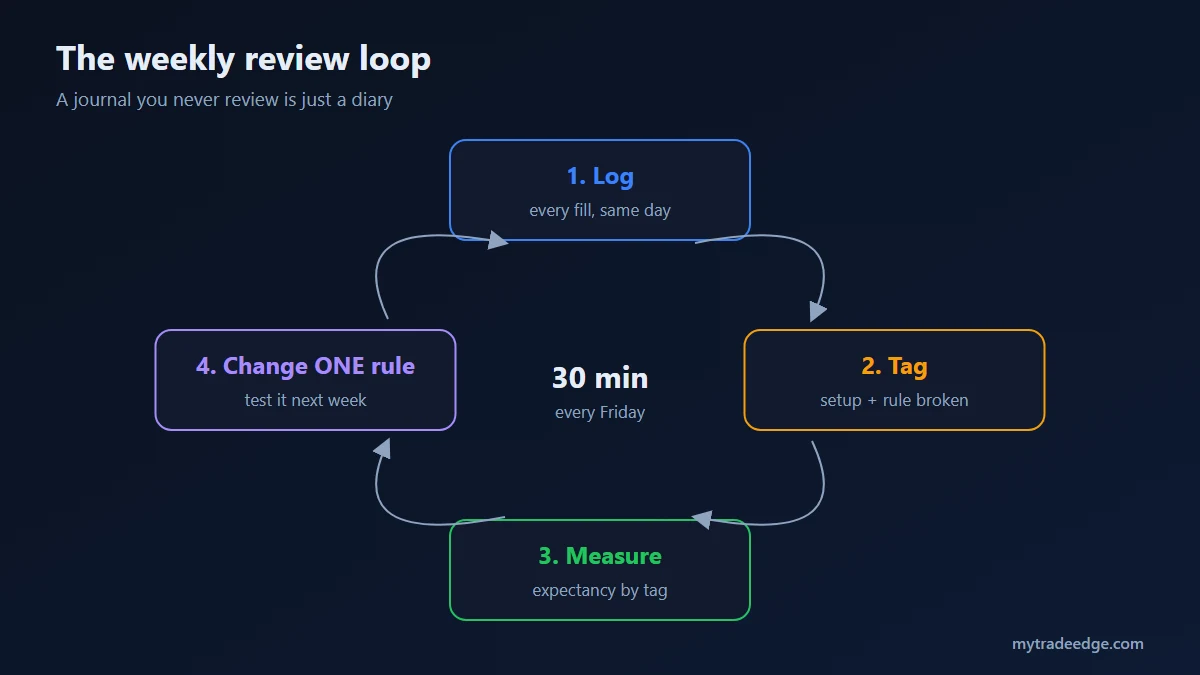
- Log. Fill in any missing fields while the week is still fresh.
- Tag. Check that every trade has a setup tag and a yes/no on the rules. Trades with no valid setup get the tag “no setup”. It is usually the most expensive tag in the journal.
- Measure. Sort by tag and by session. Look for the line with the worst expectancy, not for your best trade.
- Change one rule. For example: “no new trades after two losses in a row” or “no MNQ entries between 12:00 and 13:30 ET”. One change per week, so next week’s data can show whether it helped.
The review is where most traders quit. A journal that is filled in but never read does not improve anything; it only documents the problem.
Spreadsheet, template or journal app?
A spreadsheet or a trading journal template is fine for your first 50 trades. After that, manual entry becomes the reason people stop journaling, and an app that imports fills from your broker saves the time.
| Spreadsheet / template | Journal app | |
|---|---|---|
| Cost | Free | Free tier or monthly fee |
| Data entry | Manual, every fill | Import from broker CSV or sync |
| Futures math (ticks, multipliers) | You build the formulas | Built in |
| Prop firm limits | Manual tracking | Depends on the app |
| Best for | Learning what to track | 100+ trades a month |
If you build a spreadsheet, keep one row per trade and one column per field above, and calculate R and expectancy in separate columns. If you want the import done for you, the MyTradeEdge trading journal accepts broker CSV files, tracks prop firm loss limits and attaches screenshots to trades. If you trade through Rithmic, follow the Rithmic import guide. For a side-by-side look at the paid apps, see our comparison of TraderSync, Tradervue and MyTradeEdge.
How does a journal help with prop firm rules?
It converts the firm’s dollar limits into points and contracts before you trade. If your daily loss limit is $1,000 and you trade MNQ, that is 500 points for one contract, or 100 points for five. On NQ, the same $1,000 is 50 points for one contract.
Log the distance to your limit at the start of each day. When the journal shows you are within two full stops of the limit, the trade size for the rest of the day should fall. For a ranking of firms that allow NQ, see our prop firm guide for NQ traders. Always check the current rules on the firm’s own help center; they change often.
Common trading journal mistakes
- Logging only losers. You need the winners to calculate expectancy and to see which setups pay.
- No planned stop. Without it there is no R, and without R you cannot compare trades of different sizes.
- Too many tags. Twenty setup names give twenty tiny samples. Merge them into 4 to 6.
- Ignoring fees. On micros especially, a strategy can be profitable before fees and flat after them.
- Journaling only on bad days. The log must be complete, or every number in it is biased.
Start with your next session
Before the open, write your plan; our pre-market checklist for NQ is a good template, and the trading plan tool links each plan to the trades you take. After the close, log the 12 fields. On Friday, run the 30-minute review. After four weeks you will know more about your trading than any indicator can tell you.