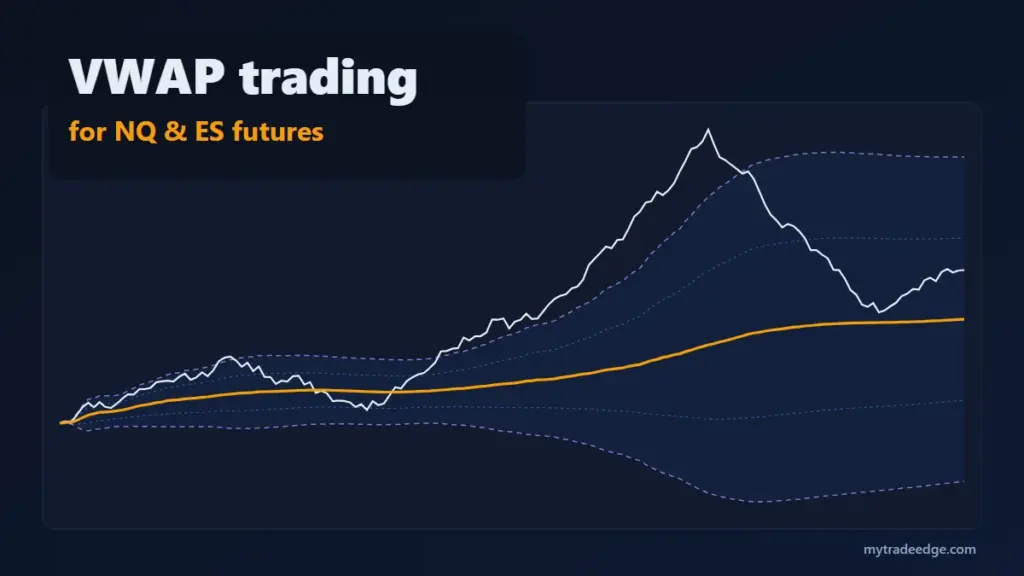
VWAP (volume-weighted average price) is the average price traded during a session, weighted by how many contracts traded at each price. For NQ and ES futures traders it works as a fair-value line: price above VWAP means buyers have paid up on average, price below means sellers are in control. It is calculated as the running sum of typical price x volume, divided by the running sum of volume.
Most VWAP guides are written for stocks, where the session simply starts at 9:30 ET. Futures trade almost 24 hours, so you also have to decide where VWAP starts. This guide covers the formula with a worked example, the standard deviation bands, the session anchor question, and three VWAP trading setups with their stops.
What does VWAP mean in trading?
VWAP shows the average price paid for every contract traded so far in the session. Unlike a simple moving average, which gives every bar the same weight, VWAP gives more weight to prices where more volume traded.
That makes it useful in three ways:
- Bias. Holding above VWAP suggests buyers are in control; holding below suggests sellers are.
- Location. A long entry far above VWAP is buying at a premium to the session average; near VWAP it is closer to fair value.
- Benchmark. Institutional execution is often judged against VWAP (NinjaTrader), so the line can attract activity during the day.
How is VWAP calculated?
For each bar, take the typical price, (high + low + close) / 3, and multiply it by the bar’s volume. Keep running totals of that product and of volume. VWAP is the first total divided by the second (QuantInsti, VWAP calculation).
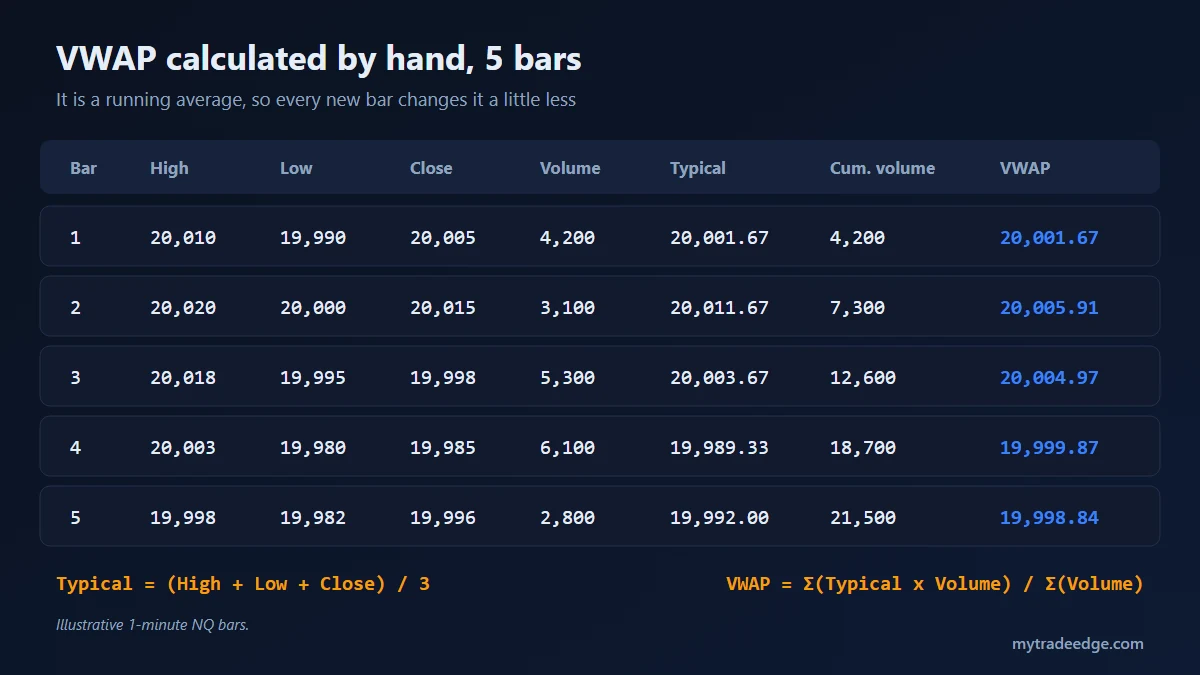
Walk through the first two bars of the example:
- Bar 1: typical price = (20,010 + 19,990 + 20,005) / 3 = 20,001.67. With 4,200 contracts, VWAP equals that typical price: 20,001.67.
- Bar 2: typical price = 20,011.67 on 3,100 contracts. VWAP = (20,001.67 x 4,200 + 20,011.67 x 3,100) / 7,300 = 20,005.91.
By bar 5, cumulative volume is 21,500 contracts and VWAP is 19,998.84. Notice how bar 4, with the most volume (6,100) and a low typical price, pulls VWAP down more than any other bar. Later in the session each new bar is a smaller share of the total, so VWAP moves less and less. That is why VWAP looks almost flat by the afternoon.
Charting platforms differ in detail; some use the close instead of the typical price, or tick data instead of bars. The differences are small on liquid contracts like NQ and ES, but keep the same setting all the time.
Where does VWAP start on futures?
On futures, VWAP can start at the Globex open (6:00 p.m. ET, the start of the CME trading day) or at the 9:30 ET cash open. The two lines can be far apart after a large overnight move, so choose one and keep it.
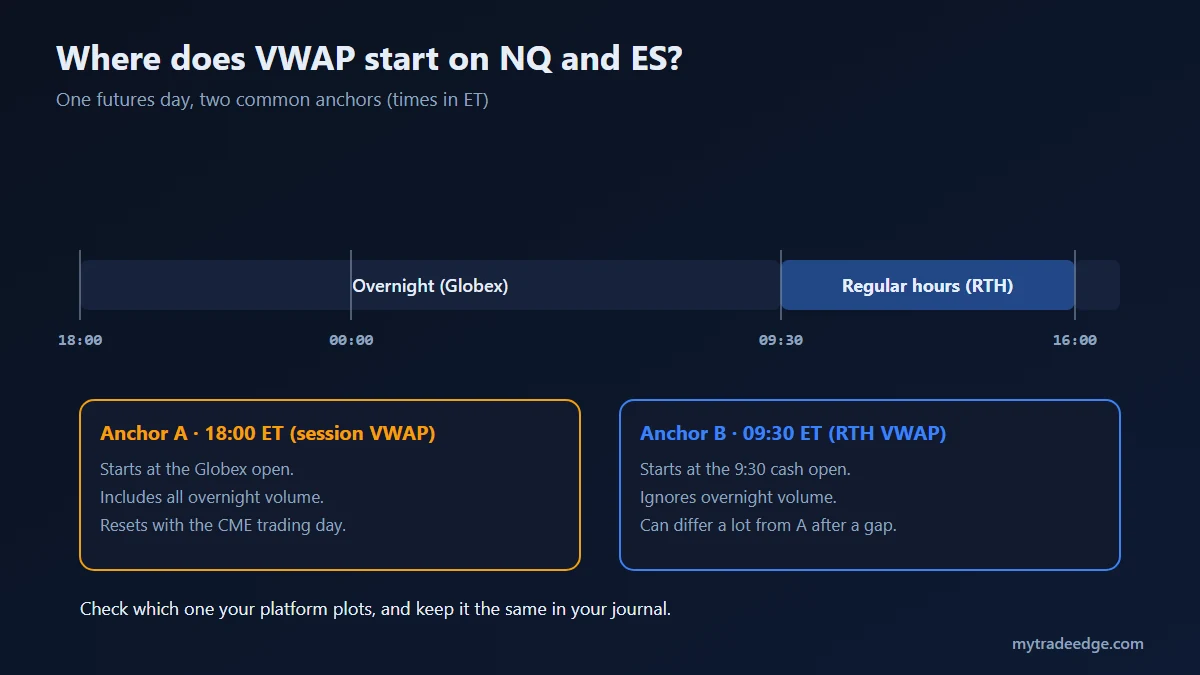
NQ and ES trade from Sunday 6:00 p.m. to Friday 5:00 p.m. ET with a daily one-hour break at 5:00 p.m. (CME Group). A session VWAP anchored at 6:00 p.m. includes all overnight trading. An RTH VWAP anchored at 9:30 a.m. ignores it and starts fresh with the cash market.
| Session VWAP (6:00 p.m. ET) | RTH VWAP (9:30 a.m. ET) | |
|---|---|---|
| Includes overnight volume | Yes | No |
| Useful during overnight hours | Yes | No (not started yet) |
| Reaction to an overnight gap | Already includes it | Starts at the new price |
| When it matters most | Trading the overnight session or the open | Trading only regular hours |
Check which one your platform plots by default. Some traders keep both on the chart and treat the zone between them as one area.
What are VWAP standard deviation bands?
VWAP bands are lines placed one, two or three volume-weighted standard deviations above and below VWAP. They measure how far price has stretched from the session average, relative to how spread out the session’s trading has been.
In practice:
- Inside ±1σ: price is near fair value; trend signals are weak here.
- Between 1σ and 2σ: a normal trending move.
- Beyond 2σ: price is stretched. In range days this often reverts; in strong trend days it can keep running along the band.
The bands widen early in the session and settle as volume builds, so early readings are less reliable than readings after the first hour.
Three VWAP trading setups for NQ and ES
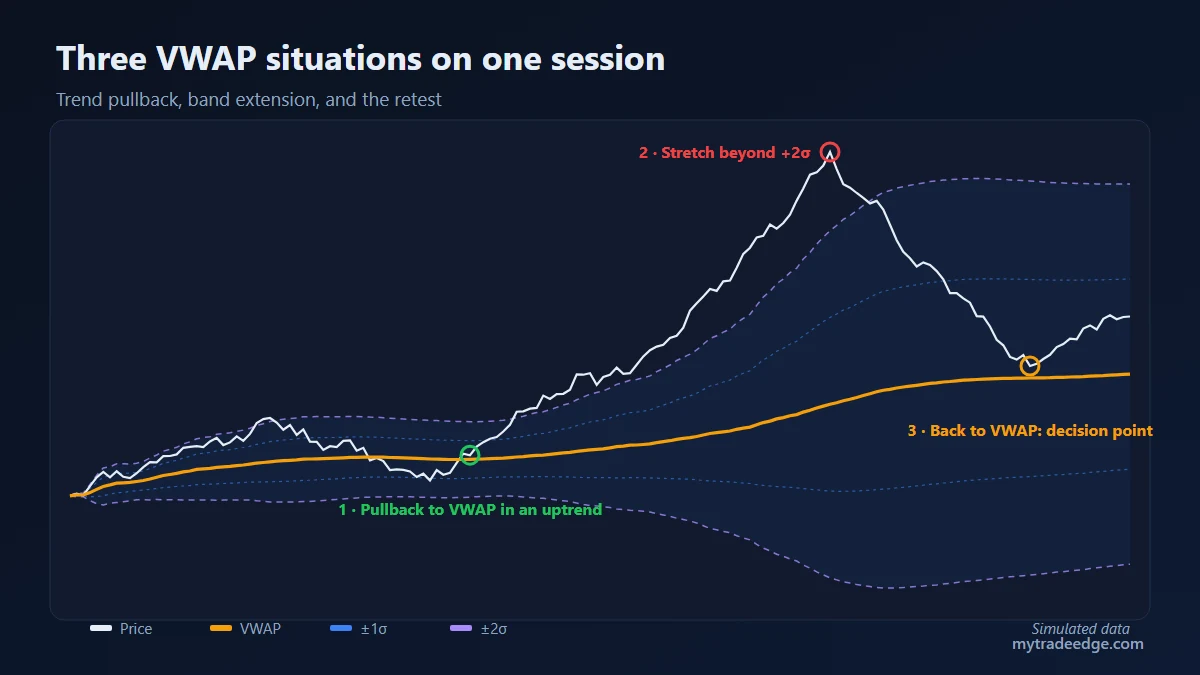
The three setups below match the numbered points in the chart at the top. They are starting points to test, not a complete strategy; each needs your own rules and a sample of trades before you risk money on it.
1. Pullback to VWAP in a trend
Context: price has held above VWAP for the first hour and VWAP is sloping up. Entry: a pullback that touches or comes close to VWAP and then prints a higher low. Stop: beyond the pullback low, or a fixed number of points below VWAP. Target: the session high or the +1σ band. The mirror version works for shorts below a falling VWAP.
2. Fade a stretch beyond 2σ
Context: a range day, no major economic release, price spikes beyond the +2σ or -2σ band. Entry: after the push stalls, for example with exhaustion on a footprint chart. Stop: beyond the spike extreme. Target: the 1σ band or VWAP itself. Avoid this setup on strong trend days; price can ride the 2σ band for hours.
3. VWAP retest after a break
Context: price crosses VWAP with momentum and then comes back to test it. Decision: if price holds on the new side, the control has shifted and you trade in the new direction; if it slips back through, the break failed. Stop: a few ticks on the wrong side of VWAP. This setup is where VWAP acts as a decision point rather than a target.
How do you size a VWAP trade on NQ or MNQ?
Size from the stop distance, never from VWAP itself. If the setup needs a 15-point stop and you risk $300, one MNQ costs 15 x $2 = $30, so you can trade 10 MNQ; one NQ would cost $300, exactly the budget with no room for fees or slippage. The full method and a sizing grid are in our guide to the NQ futures contract and tick values.
Common VWAP mistakes
- Mixing anchors. Planning on a session VWAP and trading off an RTH VWAP on another chart.
- Treating VWAP as a wall. It is an average, not an order. Price often trades through it by a few points before reacting.
- Fading every 2σ touch. On trend days that means shorting strength again and again.
- Reading it in the first minutes. With little volume, early VWAP and bands move a lot.
- Not tracking results by setup. Tag each VWAP trade as pullback, fade or retest in your trading journal and compare expectancy after 30 to 50 trades of each.
Key takeaways
- VWAP = Σ(typical price x volume) / Σ(volume), recalculated with every bar.
- On futures, decide between a 6:00 p.m. ET session anchor and a 9:30 ET RTH anchor, and keep it.
- Bands at 1σ and 2σ show how stretched price is from the session average.
- Pullback, fade and retest are three ways to use the same line; test each one separately, for example in the MyTradeEdge backtest engine, and add the rules to your trading plan.